

This article discusses optimizing application performance by managing String allocations in Java. It explains how to avoid excessive memory use through techniques like String literals, the String.intern() method, and the Java String deduplication feature. The importance of proper parameter settings and performance evaluation is emphasized for effective memory management.

The post discusses troubleshooting a 'java.lang.OutOfMemoryError: Metaspace' issue in a microservice application, which works initially but fails after a few hours. It details identifying memory leaks in the Metaspace region through garbage collection logs and heap dump analysis, ultimately resolving the issue by upgrading a problematic third-party library.

This post compares the performance of HashMap, Hashtable, and ConcurrentHashMap through practical examples. It recommends ConcurrentHashMap for its thread-safe implementation, despite being marginally slower than HashMap. Testing showed HashMap performed best, but was not thread-safe, while Hashtable was significantly slower due to its synchronization constraints.

This post discusses the advantages of setting the initial heap size equal to the maximum heap size for Java applications running on JVM. It highlights benefits like improved application availability, enhanced performance, reduced startup time, and unchanged computing costs. The article argues that this practice is particularly beneficial for enterprise applications.

ConFoo Montreal is a conference for developers that encourages knowledge sharing. Architect Ram Lakshmanan presented a session titled "Let's crash the applications!" covering issues like memory leaks, thread leaks, and deadlocks. Understanding these triggers aids in diagnosing and resolving related problems effectively. Slides from the talk are available for reference.
ConFoo Montreal is a conference for developers featuring Ram Lakshmanan, who presents on capturing 16 key artifacts during production problems, ranked 5th out of 155 sessions. The session emphasizes the importance of diagnostic information for troubleshooting and discusses effective tools for analyzing captured artifacts. Slide deck available for reference.

The author reflects on the evolution from monolithic to microservice architecture over 20 years. Initially, a monolithic application efficiently managed critical services on modest memory. In contrast, modern microservices often require significantly larger memory allocations, leading to concerns about resource consumption, response times, and overall complexity, despite their development advantages.

The 'Kill Process or sacrifice child' OutOfMemoryError occurs when processes exceed available RAM, prompting the Operating System to terminate certain processes to safeguard others. This often happens in containerized environments. Solutions include increasing RAM, minimizing unnecessary processes, and optimizing memory usage with tools like yCrash.
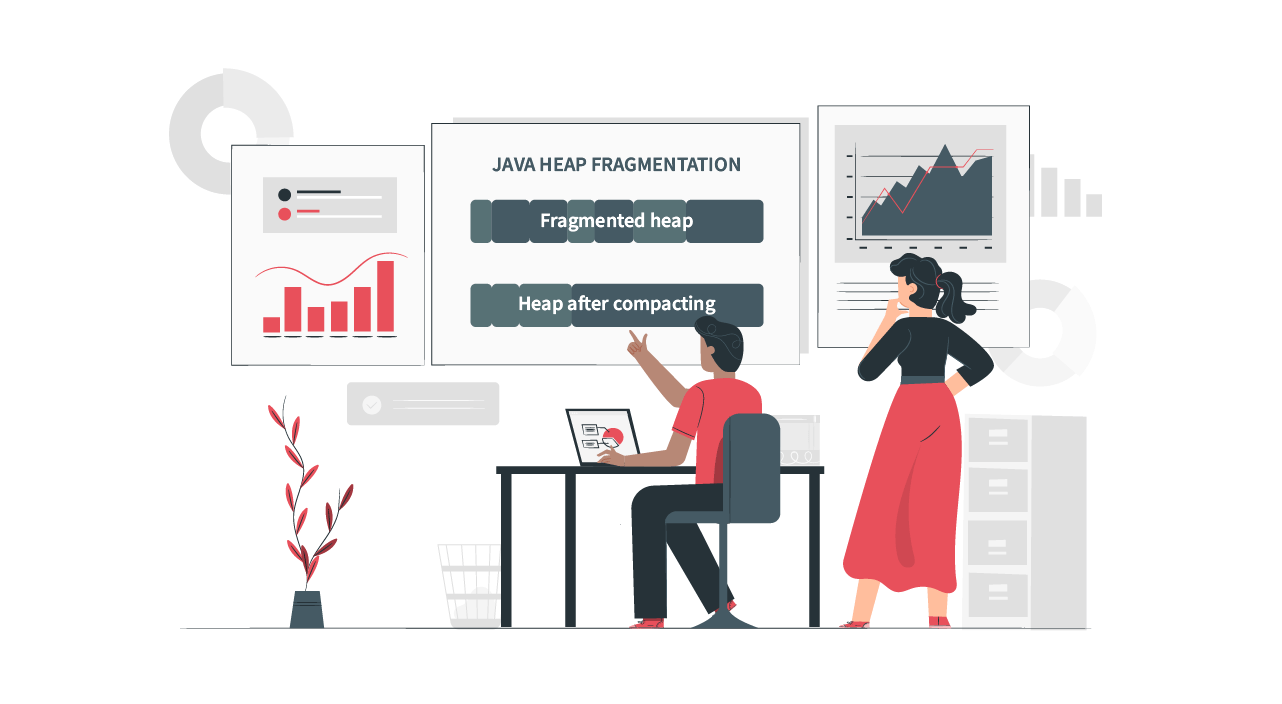
Java Heap fragmentation is an interesting problem, which triggers long pausing full garbage collection cycles. In this article we would like to attempt to explain the heap fragmentation.