

The finalize method in Java, deprecated since Java 9, poses performance concerns by delaying garbage collection and increasing memory usage. Two-step cycles for objects with finalizers, like FinalizeableBigObject, slow down processes and can lead to OutOfMemoryErrors. Ultimately, efficient resource management should prioritize try-with-resources over finalizers to improve performance.

Garbage Collection (GC) Throughput is important for Java applications. It shows how efficiently an application uses system resources. High GC throughput means fewer interruptions and better performance. Low throughput can lead to longer pauses and higher computing costs. Factors affecting GC throughput include performance issues, incorrect GC settings, and resource shortages. Addressing these factors helps optimize GC throughput and improve application performance.

We appreciate Entwinkler.de JavaMagazin for translating and publishing our article ‘Simulating and troubleshooting deadlocks in Kotlin’ in German. It’s a privilege to see our work featured in a print magazine, specifically the December 2022 issue, under the title ‘Simulation und Fehlerbehebung von Deadlocks in Kotlin’.

Garbage Collection events predominantly occur in the Java application layer, termed 'User' time, where the Garbage Collector identifies and marks active objects and evicts unreferenced ones. 'Sys' time represents the time spent in the Operating System/Kernel for memory allocation, deallocation, and disk I/O activities. Overall 'CPU' time combines both 'User' and 'Sys' time.

This article discusses the optimization of garbage collection (GC) performance to enhance application response time and reduce cloud costs. Key performance indicators include GC pause time, throughput, and CPU consumption. A successful tuning case involved reducing the young generation size from 20GB to 1GB, significantly improving GC throughput and reducing average pause time.

Analyzing garbage collection (GC) logs offers benefits such as reduced pause times, lower cloud costs, and improved capacity planning. This post outlines the process of enabling GC logs, the ideal measurement duration and environment, and tools for analysis. Key tools include GCeasy and IBM's GC visualizer for effective optimization.

The post discusses the consequences of under-allocating memory in applications, such as degraded response times and OutOfMemoryError occurrences. It emphasizes proactively monitoring Garbage Collection behavior through logs to identify memory allocation issues. Analyzing patterns in GC logs can help distinguish between high object creation due to traffic spikes and potential memory leaks.

Enabling Garbage Collection (GC) logs in applications can optimize pause times, improve response rates, predict outages, and lower costs. A study conducted on a Spring Boot application in AWS showed no significant overhead in CPU, memory usage, or response time with GC logging enabled, encouraging its use in production environments.
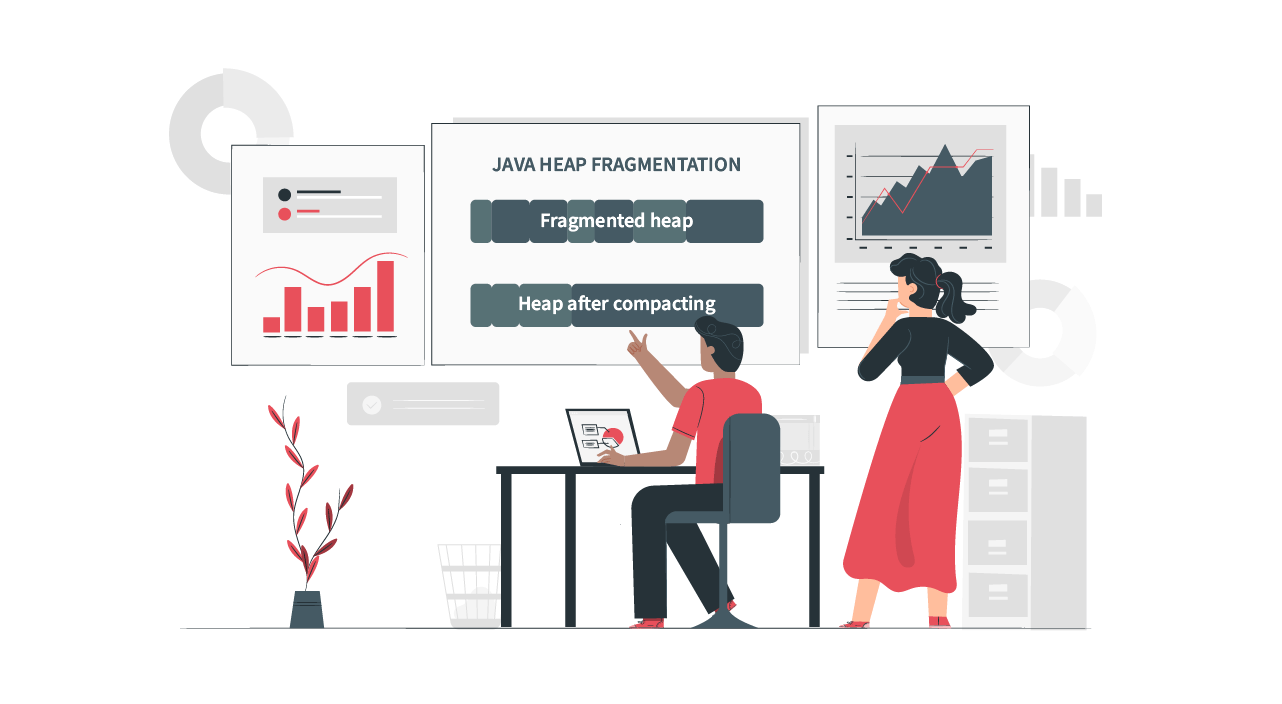
Java Heap fragmentation is an interesting problem, which triggers long pausing full garbage collection cycles. In this article we would like to attempt to explain the heap fragmentation.