

Recently we confronted an interesting ‘java.lang.OutOfMemoryError: Metaspace’ problem in a Microservice application. This Microservice application will run smoothly for initial few hours, later it will start to throw java.lang.OutOfMemoryError: Metaspace. In this post let me share the steps we pursued to troubleshoot this problem.
Video: To see the visual walk-through of this post, click below:
What is OutOfMemoryError:Metaspace?
JVM memory has following regions:
a. Young Generation
b. Old Generation
c. Metaspace
d. Others region
When you encounter ‘java.lang.OutOfMemoryError: Metaspace’, it indicates that the Metaspace region in the JVM memory is getting saturated. Metaspace is the region where metadata details that are required to execute your application are stored. In nutshell it contains class definitions, method definitions and other metadata of your application. To learn more about what gets stored in each of the JVM memory regions, you may refer to this video clip.
Note: There are 9 different types of java.lang.OutOfMemoryError. You can learn about those OutOfMemoryError from here. 'java.lang. OutOfMemoryError: Metaspace’ is one type of them. But not a common type though.
How to Debug java.lang.OutOfMemoryError: Metaspace in a Microservice?
Best place to start debugging ‘java.lang.OutOfMemoryError‘ is the Garbage Collection log. If you haven’t enabled garbage collection log for your application, you may consider enabling it by passing the JVM arguments mentioned here. Enabling garbage collection log doesn’t add noticeable overhead to your application. Thus it’s recommended to enable garbage collection log on all production JVM instances. To see the great benefits of garbage collection log, refer to this post.
We uploaded the garbage collection log of this troubled microservice application to the GCeasy – GC log analysis tool. Here is the GC log analysis report generated by the tool. Below is the Heap usage graph reported by the tool.
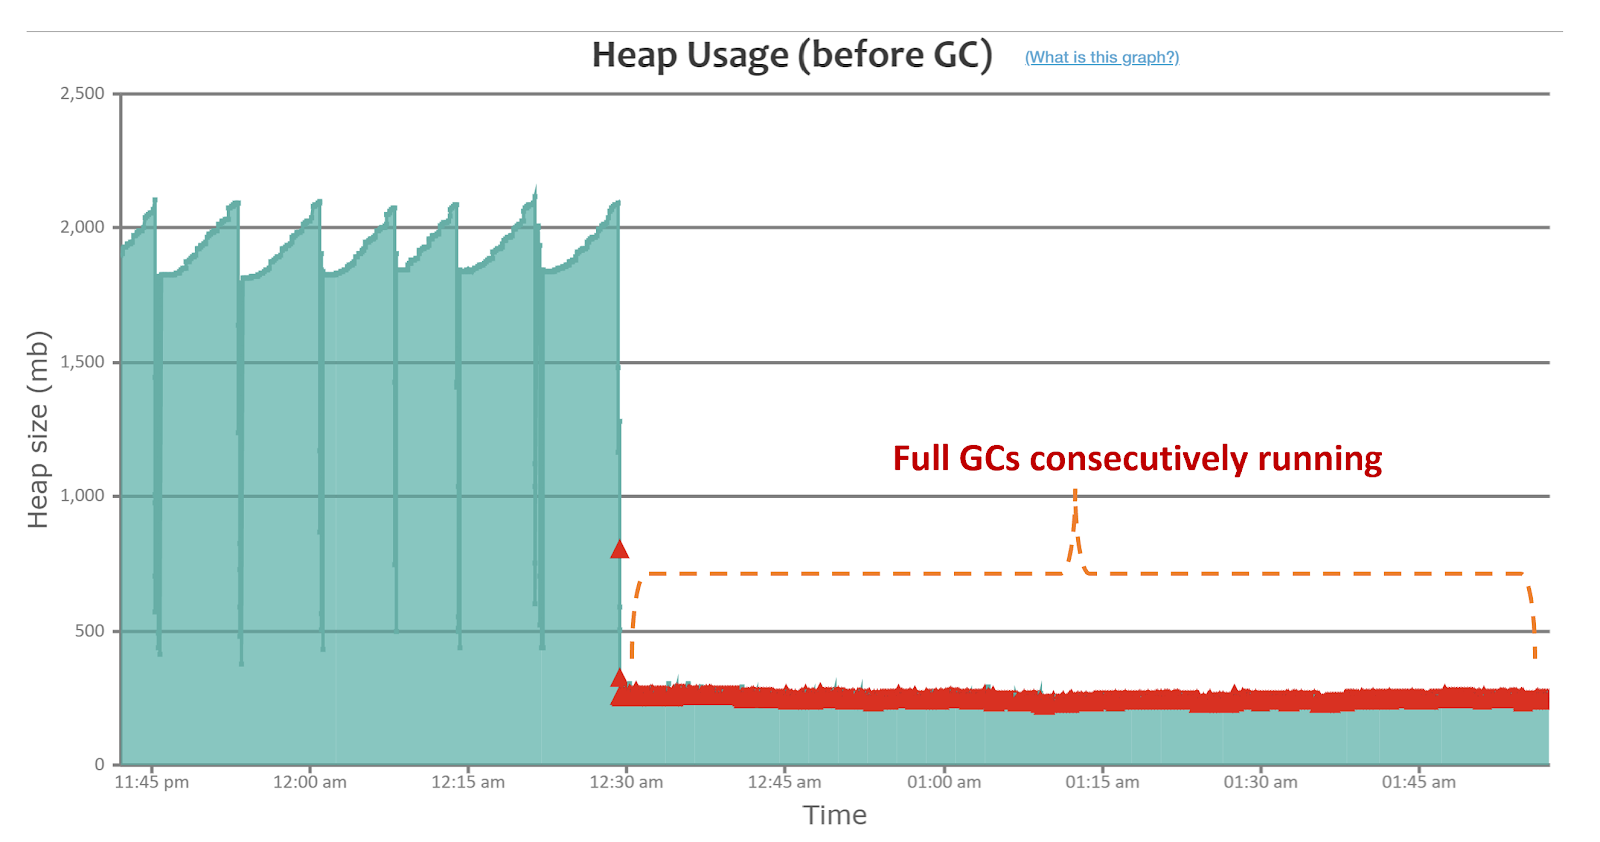
Fig: Heap usage graph reported by GCeasy
I would like to highlight few observations in this graph:
a. Red triangle in the graph indicates the occurrence of the Full Garbage Collection event. When the Full garbage collection event runs, it pauses your entire application. It tries to free up memory from all the regions (Young, Old, Metaspace) in the memory. You can see Full Garbage Collection events to be running consecutively from 12:30am
b. Even though maximum heap memory size is 2.5GB, Full Garbage collection events were consecutively triggered even when heap memory usage is only at 10% (i.e. 250MB) of its maximum size. Typically, Full garbage collection events are consecutively triggered when heap memory grows to its maximum size. To understand why this happens, please review next point #c.
c. Below is the Metaspace region’s memory consumption graph from the report:
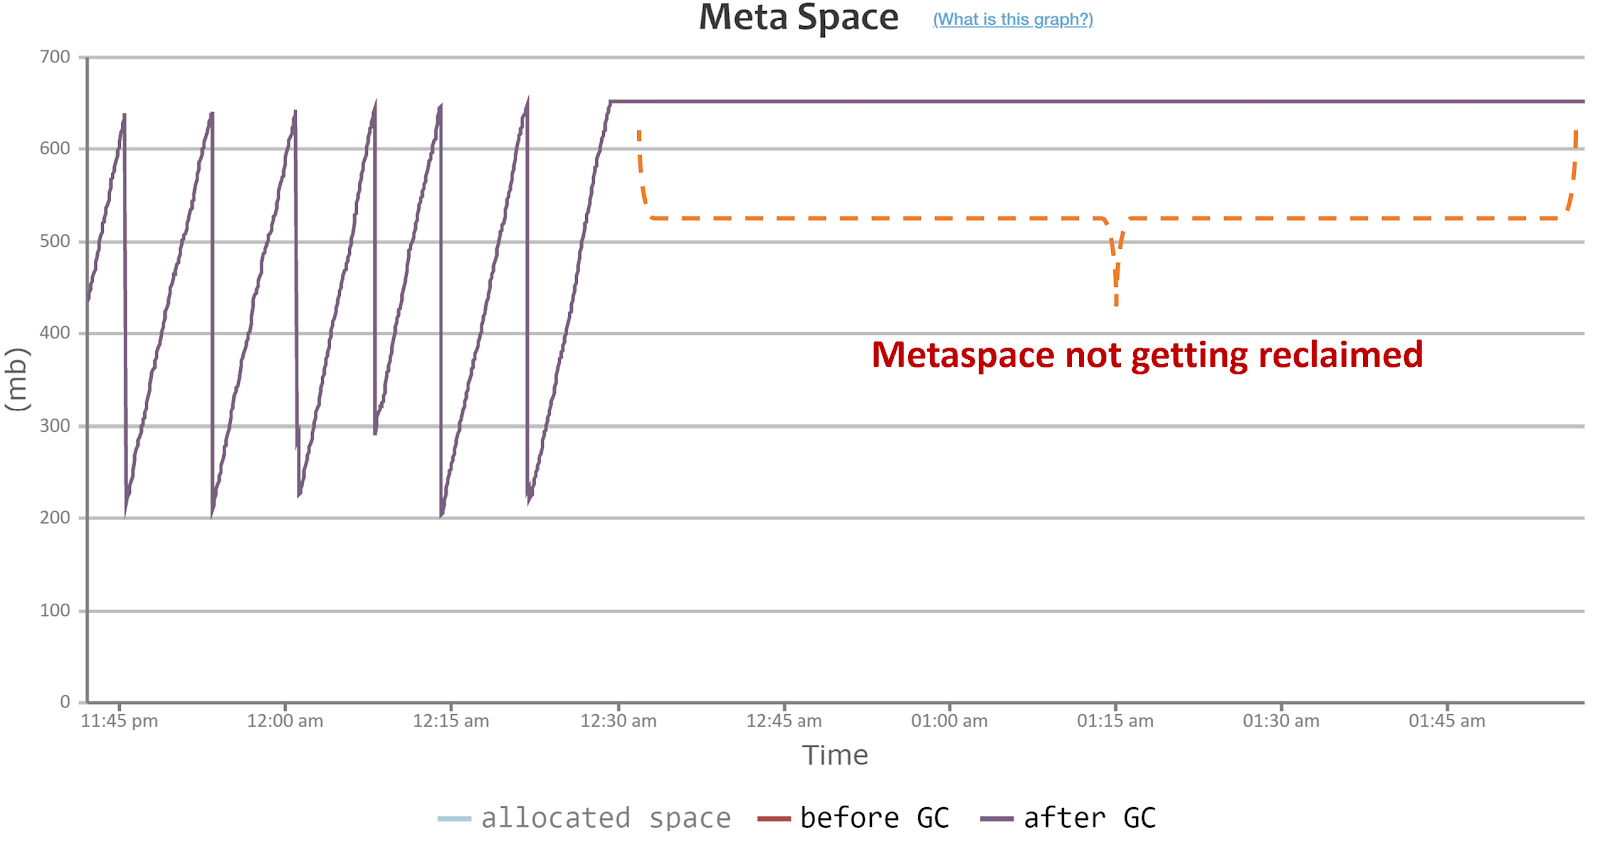
Fig: Metaspace usage graph reported by GCeasy
You can notice the Metaspace region’s memory consumption growing and dropping in a saw-tooth pattern till 12:30am. After 12:30am, Metaspace region’s memory consumption isn’t dropping at all, even though Full GCs are consecutively running. It indicates Garbage collection events aren’t able free up Metaspace. It clearly indicates there is a memory leak in the Metaspace region.
What Causes java.lang.OutOfMemoryError: Metaspace?
Now we have confirmed that a memory leak is happening in the Metaspace region. Thus the next logical step is to inspect the Metaspace region and try to understand what objects occupy this region. Here is a post which summarizes the 5 different approaches to study the contents in the Metaspace region. We went for the heap dump analysis approach.
Basically we used the yCrash tool to capture the heap dump and analyze it. Tool instantly pointed out the problem. Tool was reporting a thread which was experiencing OutOfMemoryError. Apparently, this thread was experiencing OutOfMemoryError when invoking a 3rd party library. Due to a bug this 3rd party library was creating new class definitions for every new request. This application was running on an older version of this 3rd party library. However, this bug was fixed in the latest version of the library. Once the 3rd party library was upgraded to the latest version, this problem got resolved.


April 18, 2023 at 6:26 am
Hi, this content was really helpful. I have the smae problem in my application as well. i have got the heapdump. I am not sure how to identify which library is causing this issue from the heapdump. can you please help
April 18, 2023 at 1:19 pm
While you await their thoughts on that specific question, tell us what (if anything) you have set for the maxmetaspacesize jvm argument. Rather than fight what’s filling that space, sometimes the eaiser solution is to raise that (it may be set to just hundreds of mb).
Or you can simply REMOVE that arg, and the jvm will use available os memory for the metaspace. The point is that often its use is not that large, but just constrained by someone having set that value.
And sometimes someone has set it rather mindlessly, often having simply changed the maxpermsize arg (from Java 7 and earlier) to maxmetaspacesize (new in java 8 and above). They’re SIMILAR in purpose but NOT the SAME, and in particular the old arg had a tiny default so people often HAD to specify it. Again, one of the changes for the new arg is that it HAS NO DEFAULT MAX value AND it does not pull memory from the Heap but instead from available OS memory.
That’s why, for many folks, the simplest solution to this error is just to remove the maxmetaspacesize, or increase it. But sure, if one WANTS to instead understand its usage, then studying what classes are being loaded (and their rates over time) is an approach to consider. I’ll leave the folks here to elaborate on that in their post/s.
Hope the rest here may help you or others in the meantime.
April 25, 2023 at 7:04 am
In this post five different approaches given on how to discuss different metaspace. Please do check on it.