

JVM powers several mission critical applications all over the world. However, JVM is a black box for several of us. When we start to explore its inner working & nuances of JVM, it will fascinate us. In this post, let’s explore JVM’s primary Internal components: Heap, Stack & GC. Let’s discuss what they are? How do they operate? How to configure their sizes? What are the commonly confronted errors in them?
JVM Memory Regions
In order to learn about Heap, Stack and GC, first we need to understand JVM’s internal memory regions. Here is a video clip that gives a good introduction about different JVM memory regions. But in nutshell, JVM has following memory regions:
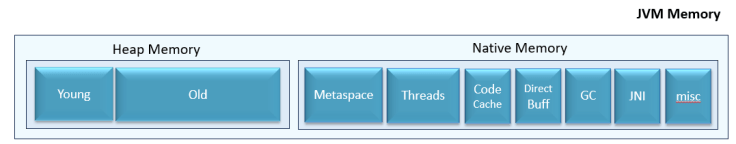
Fig: JVM Memory Regions
1. Young Generation: Newly created application objects are stored in this region.
2. Old Generation: Application objects that are living for longer duration are promoted from the Young Generation to the Old Generation. Basically, this region holds long-lived objects.
3. Metaspace: Class definitions, method definitions and other metadata that are required to execute your program are stored in the Metaspace region. This region was added in Java 8. Before that metadata definitions were stored in the PermGen. Since Java 8, PermGen was replaced by Metaspace.
4. Threads: Each application thread requires a thread stack. Space allocated for thread stacks, which contain method call information and local variables are stored in this region.
5. Code Cache: Memory areas where compiled native code (machine code) of methods is stored for efficient execution are stored in this region.
6. Direct Buffer: ByteBuffer objects are used by modern framework (i.e. Spring WebClient) for efficient I/O operations. They are stored in this region.
7. GC (Garbage Collection): Memory required for automatic garbage collection to work is stored in this region.
8. JNI (Java Native Interface): Memory for interacting with native libraries and code written in other languages are stored in this region.
9. misc: There are areas specific to certain JVM implementations or configurations, such as the internal JVM structures or reserved memory spaces, they are classified as ‘misc’ regions.
Java Heap
From the above section, you can infer that Java Heap consists of two regions:
a. Young Gen
b. Old Gen
All the newly created application objects (like Customer, Account, …) are stored in the Young Gen. 80% of objects that we create are short lived. However certain objects live for a longer duration (like HttpSession, Database Connection, Cache…). Those long lived objects get promoted from the Young Gen to Old Gen. JVM partitions the heap into these two regions to optimize Garbage Collection Performance.
JVM’s heap size can be controlled by passing the -Xmx flag. Example: when you configure -Xmx2g, JVM will be launched with heap size of 2GB. By default, Young Gen occupies 1/3rd the size and Old Gen occupies 2/3rd the size of the heap. You modify the Young Gen size by configuring the -Xmn or -XX:NewRatio flag.
When Young Gen and Old Gen space is exhausted, JVM will throw either one of the following Errors: java.lang.OutOfMemoryError: Java Heap Space or java.lang.OutOfMemoryError: GC overhead limit exceeded.
Java Stack
Threads are an integral part of JVM. Threads are the ones that execute our application code. Each thread has its own stack. It contains the thread’s program counter and a set of frames for each uncompleted method. The frame contents include:
1. All local variables that were defined as primitive data types.
2. Pointers to local variables that were defined as objects – the actual objects reside in the heap.
3. Other information needed to retain context.
If you would like to learn more specifically on what specifically gets stored in thread’s stack with concrete examples, I would recommend reading the blog post: ‘What is the Stack in Java and How Does it Work?’
You can set the thread’s stack size by configuring JVM flag -Xss. When you configure -Xss1m, each thread in the JVM will be allocated a stack of 1MB. When a single thread’s size exceeds the allocated stack size, StackOverflowError will be thrown. If the application creates way too many threads, then java.lang.OutOfMemoryError: Unable to create new native threads are thrown.
Difference Between Heap and Stack
Below table summarizes the difference between Java Heap and Stack.
| Heap | Stack | |
| Usage | Stores objects | Stores primitive local variables, local variables object pointers & method calls |
| JVM Flag to configure Size | -Xmx sets the size of Heap | -Xss sets size of Thread |
| Scope | Shared across threads | Thread-Specific |
| When exceeds limits | ‘OutOfMemoryError:Java Heap Space’ or ‘OutOfMemoryError: GC overhead limit exceeded’ | ‘StackOverflowError’ is thrown whenThread’s stack exceeds allocated Size.‘OutOfMemoryError: Unable to create new native threads’ are thrown when too many threads are created. |
Garbage Collection
Automatic Garbage Collection is one the great capabilities of Java, which made it to become a popular programming language. In the Java language and other programming languages that run on JVM (such as Scala, Jython, Kotlin,…), developers only create objects. They don’t de-allocate the objects from memory. Java’s Garbage Collector will automatically deallocate the objects from memory. However, in the predecessor languages, developers have to both allocate and deallocate objects.
To do the automatic garbage collection, JVM will pause our application, so that it can find active, inactive objects and remove the inactive objects from memory. If pause time becomes too large, application’s response time will degrade, and computing cost will start to increase. Here is a real case study where Uber has to optimize their GC performance to reduce their ballooning computing cost. Here is another case study where a very large automobile manufacturer has to optimize their GC settings to improve their overall application response time by 50%. To study the GC performance and optimize its performance, you can use tools like GCeasy, which can study your GC behavior and provide optimal JVM settings.
Currently there are 7 different GC algorithms in Open JDK:
| GC Algorithm | Description |
| Serial GC | A simple, stop-the-world, single-threaded garbage collector designed for small applications with low memory footprints. |
| Parallel GC | A throughput-focused garbage collector that uses multiple threads for minor and full GC operations to improve performance. |
| CMS GC | The Concurrent Mark-Sweep collector reduces pause times by performing most of its work concurrently but is deprecated and replaced by modern collectors. |
| G1 GC | The Garbage-First collector optimizes pause times by incrementally collecting garbage in regions rather than entire heap generations. |
| Shenandoah GC | A low-pause-time collector that performs concurrent compaction, reducing stop-the-world events significantly. |
| ZGC | An ultra-low-latency collector designed to handle large heaps (up to terabytes) while keeping pause times under a few milliseconds. |
| Epsilon GC | A no-op garbage collector that does no memory reclamation, useful for testing and benchmarking applications without GC overhead. |
Choosing the right GC algorithm plays a key role in influencing your application’s performance. What is the right GC algorithm for my application post, talks about how you can go about approaching the right GC algorithm for your application.
If you are looking to tune your GC performance, I would recommend reading this post: 9 Tips to Reduce GC Pause Time.
How Heap, Stack & GC Work Together?
In the above video clip, I walkthrough how JVM executes a sample Java program. Through this process I have tried to explain how Java Heap, Stack and GC work together.
Conclusion
Hopefully this post gave a good introduction to Java Heap, Stack and GC and how they interoperate between each other to execute our applications. In case you want to learn more about JVM Performance Engineering & Troubleshooting, you are welcome to attend my online JVM Performance Master Class.


1 Pingback